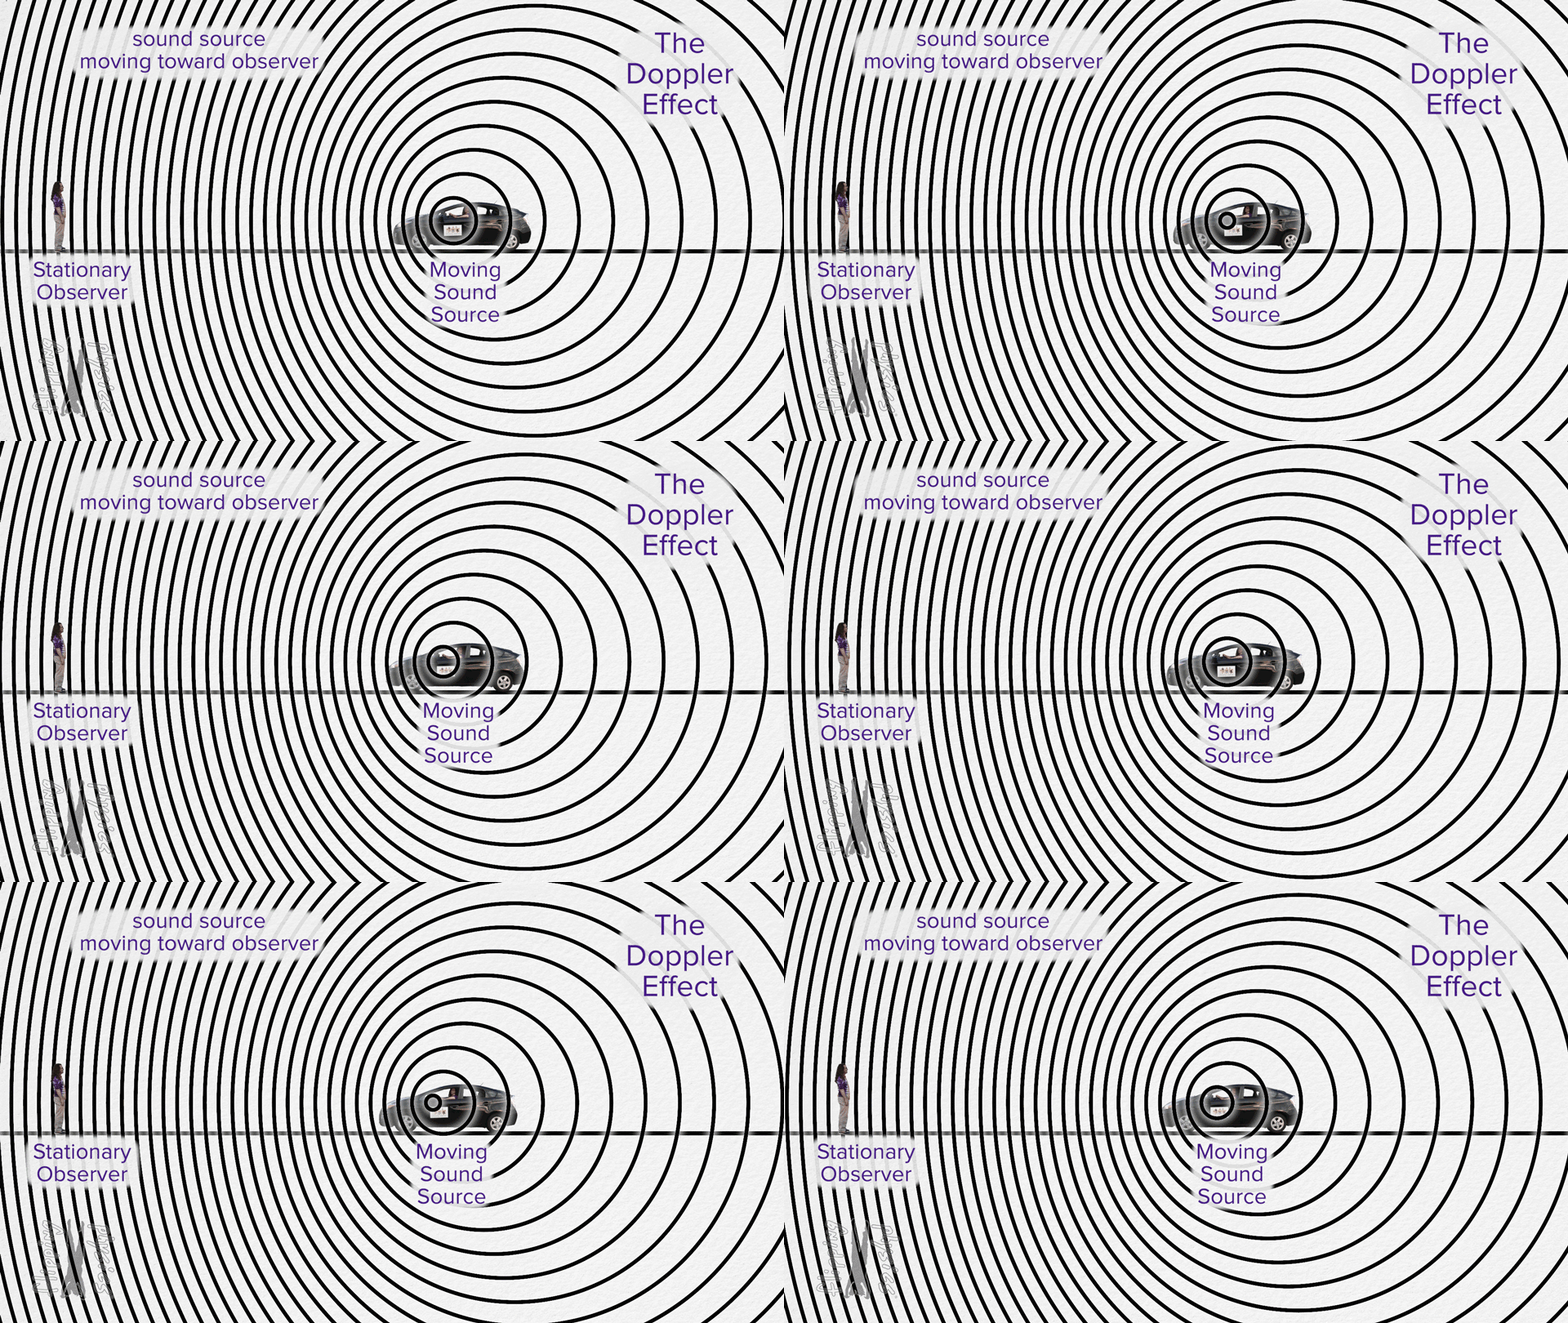
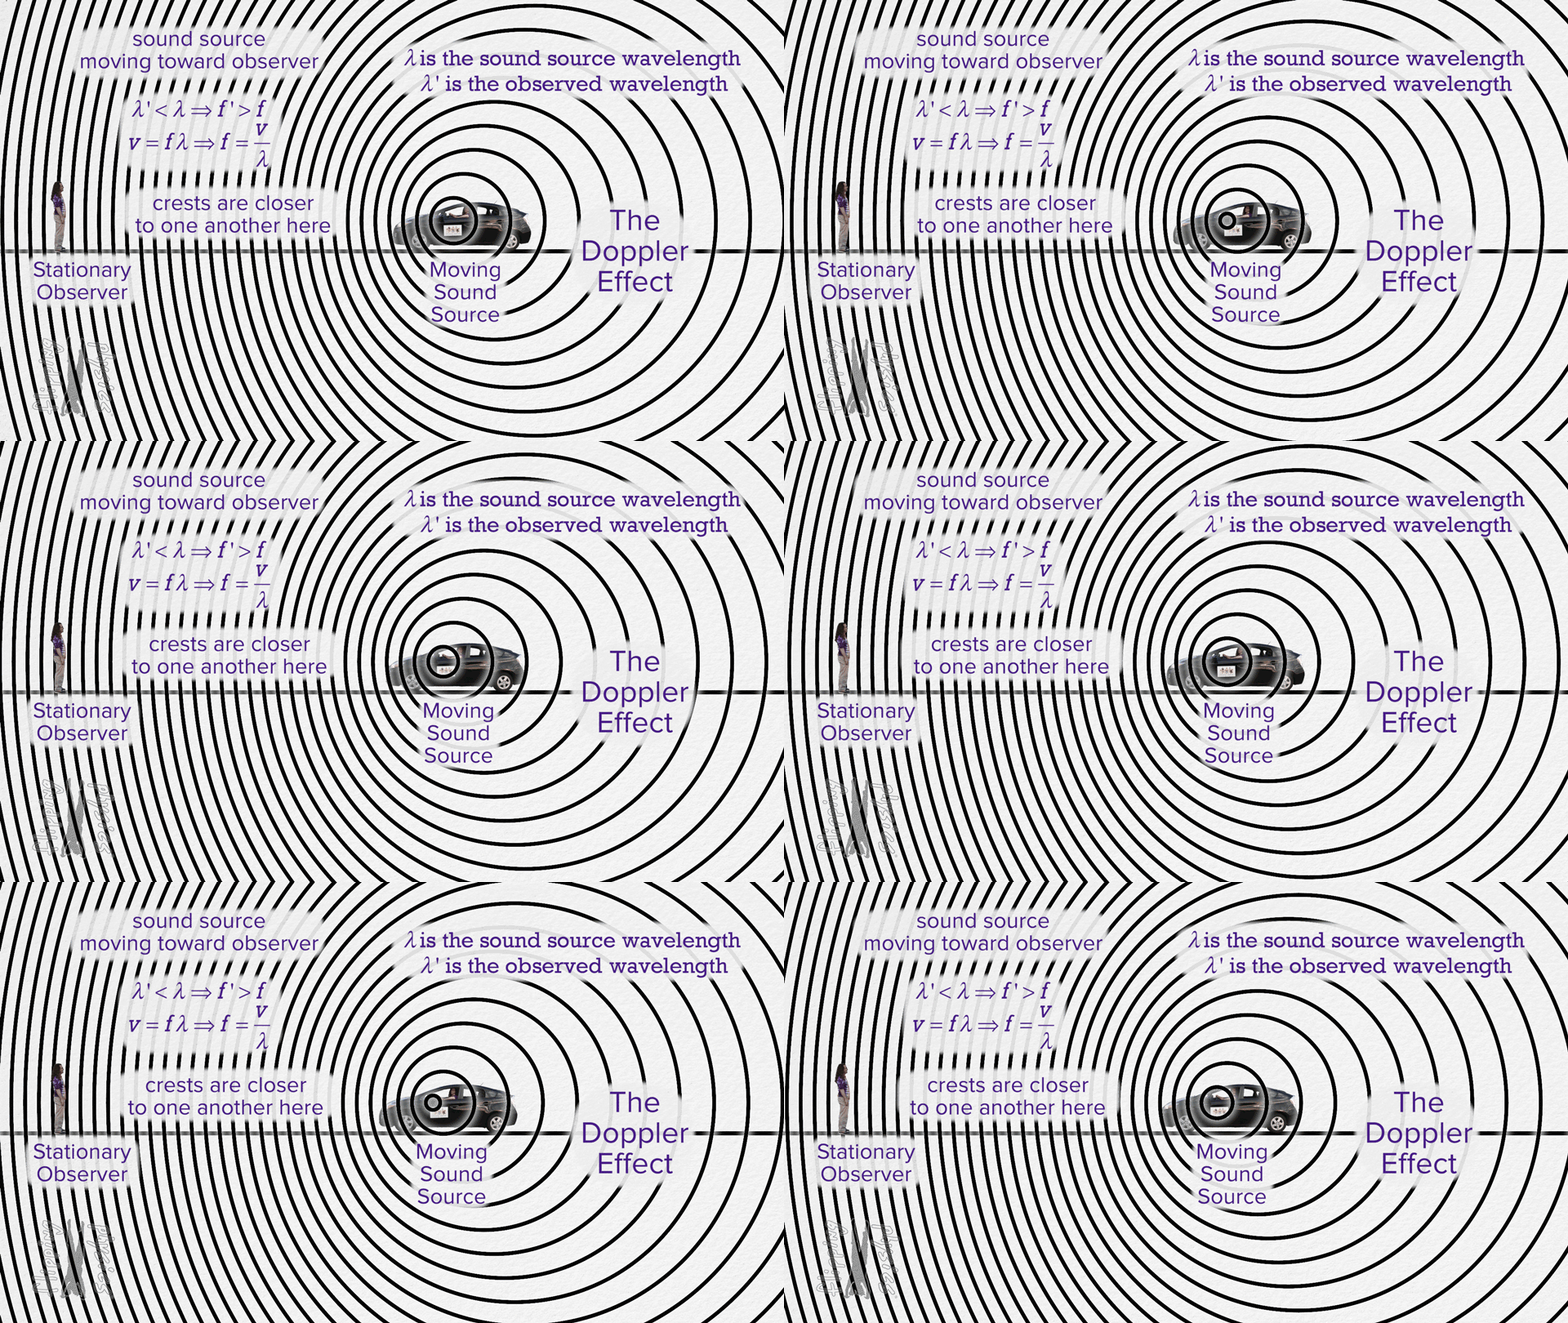
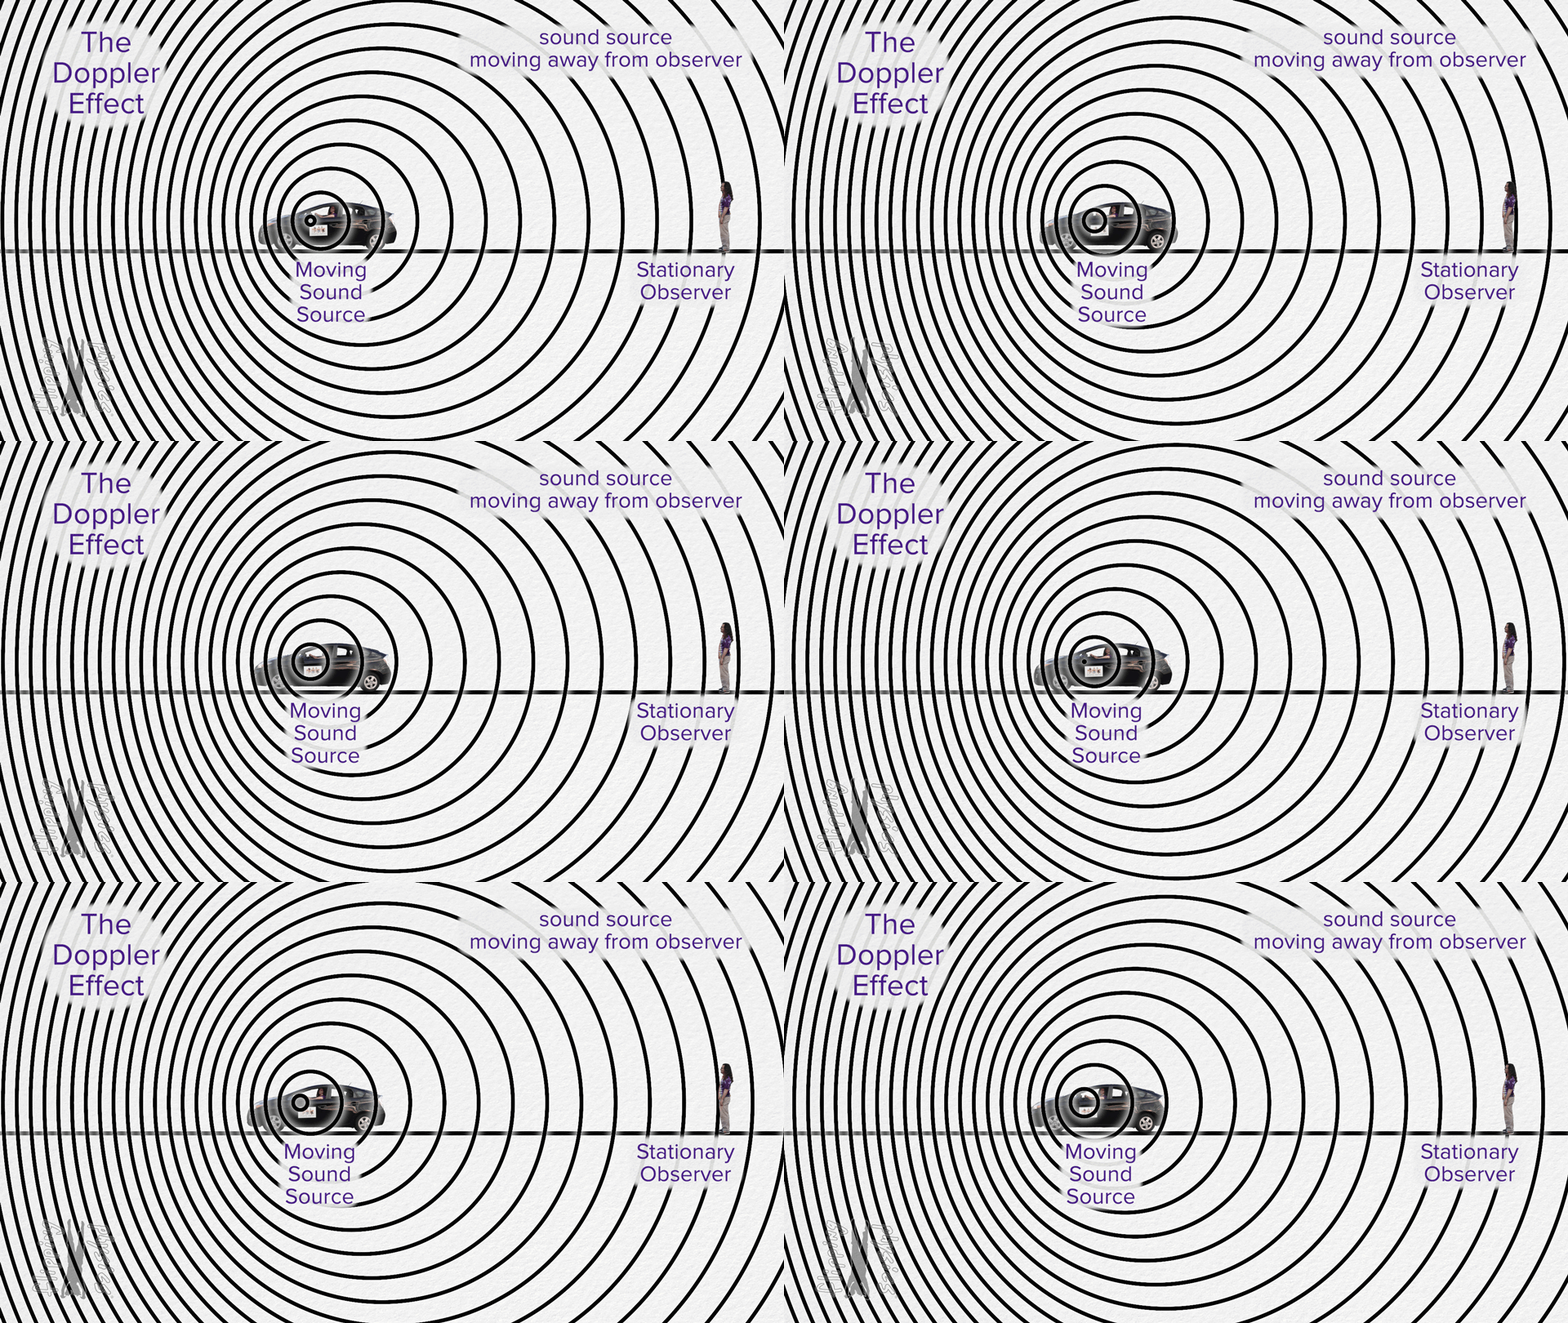
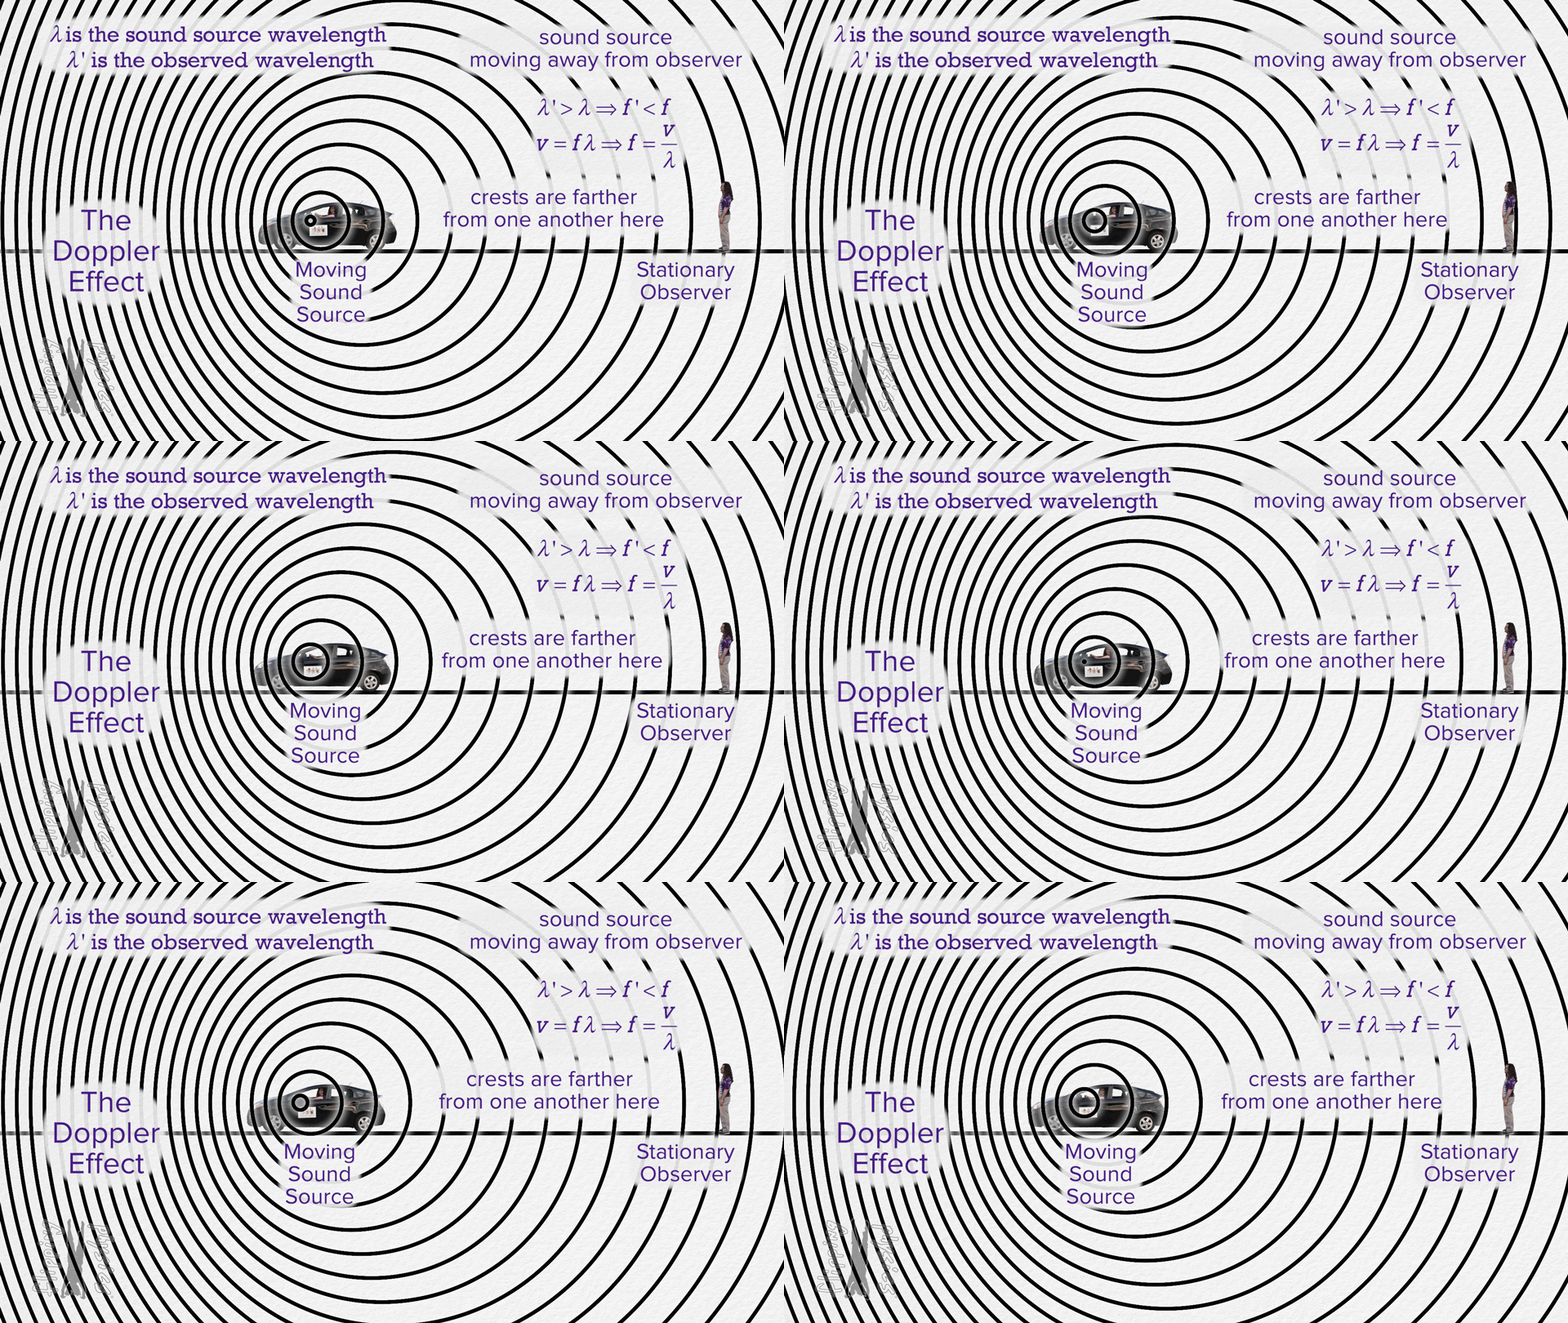
Doppler Effect Demonstrations and Animations (7:24)
|
The Doppler Effect is demonstrated. Animations are used to show the observed change in wavelength and frequency. This is an AP Physics 1 Topic.
Content Times: 0:01 Doppler Effect Demonstration 0:39 Stationary sound source animation 2:49 Moving sound source animation 3:29 Sound source moving toward observer 5:09 Sound source moving away from observer 5:43 Hearing the sound source in the car 6:41 What if the observer is moving? |
|
I have one small correction. To quote El Jison: "at the end of the video you said that the observed wavelength changes when the source is stationary but the observer moves. That is incorrect. The distance between wavefronts (the observed wavelength) does not change in this case. However, because the observer is moving towards or away from the source of the sound, the frequency (and hence, the pitch) of the sound will increase because the observer will pass more wavefronts during the same amount of time than if both the source and the observer were stationary. The opposite is true when the observer is moving away from a stationary source, the observed wavelength is the same as the rest wavelength, but the frequency (and pitch) decreases because a fewer number of wavefronts (peaks) pass the moving observer when moving away from the source of the sound. This is easier to see with a picture/diagram with the moving concentric circles. If you consider the wavefronts moving outward from the stationary car, ... the wavefronts are not compressed. However, If the observer moves towards the car they will pass more wavefronts per unit time and hear a higher frequency while observing the same wavelength."
Sorry about that and thank you El Jison!
Sorry about that and thank you El Jison!
- Multilingual? Please help translate Flipping Physics videos!
- Please support me on Patreon!
- Thank you Scott Carter, Christopher Becke, and Cameron Vongsawad for being my Quality Control team for this video.
- Picture credit: Christian Doppler


